Mutual Fund Asset Class Returns 31Mar2024
(This
is for information purposes only. This should not be construed as a
recommendation or investment advice even though the author is a CFA Charterholder. Please consult your financial
adviser before taking any investment decision. Safe to assume the author has a vested
interest in stocks / investments discussed if any.)
This is an update of an earlier blog
posted on 28Jan2024. Now,
an analysis of the data as at the end of 31st of March, 2024 is
presented here. The data contain select categories of mutual funds in
India, numbering sixteen, from equity, debt and commodity (gold)
categories.
(the blog continues below)
-------------------
Related Blogs on Mutual Funds:
NSE Indices (Nifty 50, Nifty Next 50, Nifty 100 and Nifty 500) Comparison 31Dec2022
Who is Eating My Gold ETF Return?
-------------------
Table 1: Asset return matrix - annual returns (arranged from top to bottom returns in 2023) >
Please click on the image to view better >
Table 1 above reveals:
> asset class returns are cyclical in nature
>
gold exchange traded funds (ETFs) did well both in calendar years 2023 and 2022; the asset class did well in first quarter of 2024 also
> while large-, flexi- and mid-cap equity funds have provided decent returns in the first quarter of 2024, small-cap funds have failed to impress
> in the debt category, gilt and dynamic bond funds have provided decent returns in the first quarter of 2024
The
contents of the above table 1 are presented below, with the same data, but in alphabetical order
>
Please click on the image to view better >
Table
3: Asset return matrix - trailing returns as on 31Mar2024 (10-year returns top to bottom) with category AUM or assets under management
>
Please click on the image to view better >
What
table 3 above reveals is:
> Small-cap
equity funds have provided best returns on a 10-year trailing returns basis,
though they have provided negative returns as a category in 2022, 2019 and 2018
> however, investors in
small-cap equity funds have to tolerate higher volatility and it’s in the
nature of equities to suffer from volatility of returns; year-to-date, their returns have failed to impress
> of the selected funds, equity large-cap has provided the best returns year-to-date (YTD)
> gold ETFs (exchange traded funds) and equity international funds too have done well YTD
> table 3
also provides assets under management (AUM) of respective category as of
31Mar2024, so that readers can have a sense of the popularity of the
mutual fund categories among investors
> investors have a tendency to move from one category to another category as part of their rotation among asset classes as well as within asset classes
The
contents of the above table 3 are presented below, with the same data, but in alphabetical order
>
Please click on the image to view better >
Mutual Fund Categories with Similar Returns
Section A. Flexi cap and ELSS funds provide similar returns
If you observe the trailing and annual returns of some mutual fund categories, their returns are similar over a long period of three or more years. Even in the short term of less than three years, returns of some mutual fund categories tend to have similar returns.
Let us look at the screenshots attached below:
Screenshot 1: Equity MF category returns: Trailing returns
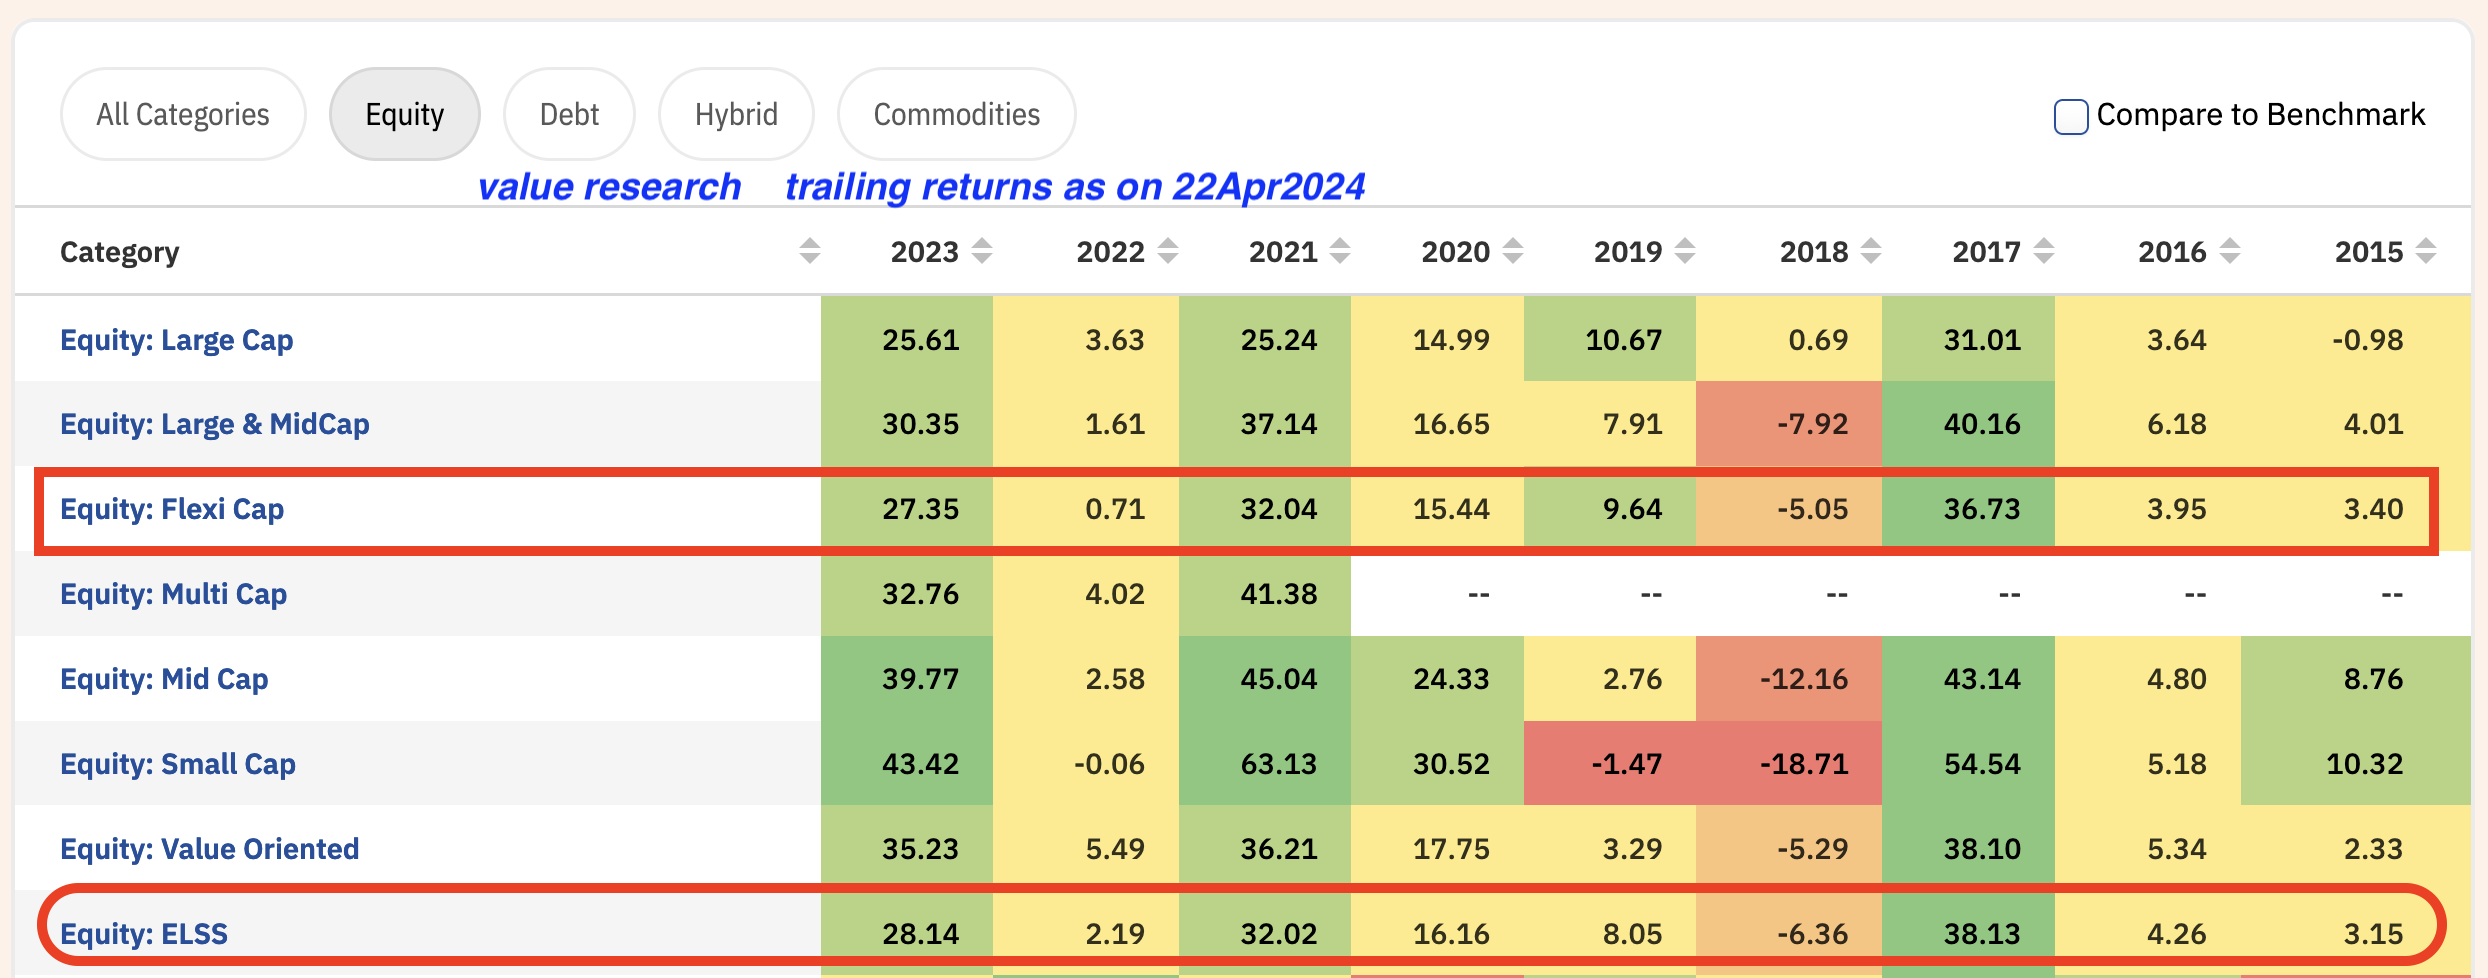
Screenshot 2: Equity MF category returns: Annual returns
A rough glance at the above two screenshots indicates that the returns of flexi cap and ELSS (equity linked savings schemes or tax savings schemes) categories are similar to each other.
As flexi cap and ELSS categories offer similar returns over the short- and long-term, there is no point in holding both the funds in one's portfolio. Instead of holding two funds in these two equity fund categories with similar returns, one can hold only one category of fund, unless one wants to benefit from tax savings offered by ELSS funds.
In portfolio theory, one should not hold correlated
assets. Correlation means the relation between two asset types and how much
they tend to vary with one another. To reduce risk, it’s better to hold
uncorrelated assets in a portfolio.
Mutual fund investors tend to hold a zoo of funds ignoring the principles of appropriate portfolio diversification. Take for example, three or four large-cap equity funds of your choice.
You would observe that these funds hold the same set of stocks in their portfolio -- they are usually from private sector banks, public sector banks, capital goods stocks, oil refineries, power stocks, technology and pharma stocks.
That's why most of the time, equity mutual funds are unable to provide superior returns to investors.
Section B. Gilt funds and other debt funds tend to provide similar returns
Let us look at some categories of debt funds:
Screenshot 3: Equity MF category returns: Trailing returns
Screenshot 4: Equity MF category returns: Annual returns
Data in screenshots 3 and 4 above shows that debt fund categories, like, gilt, dynamic bond, Banking & PSU, corporate bond and floater fund have similar returns, though in the long term, gilt funds tend to provide slightly higher returns compared to other categories analysed here.
Section C. Trailing and Annual returns of funds that tend to provide similar returns
Table 5: Trailing returns of fund categories with similar returns:
Table 6: Annual returns of fund categories with similar returns:
As shown in tables 5 and 6 above, the returns of equity large-cap and aggressive hybrid fund categories are similar.
Returns of gilt, dynamic bond, Banking & PSU, corporate bond and floater categories of debt are similar; though gilt fund returns are slightly higher (this is borne out in Section A and B above).
The returns of liquid (debt mutual fund) and arbitrage (hybrid MF) are similar.
Section D: Risk measures of select MF categories:
Table 7: Sharpe ratio of select MF categories:
Table 8: Standard deviation of select MF categories:
Tables 7 and 8 provide details of risk measures of the mutual fund categories and their similarity.
Though standard deviation of aggressive hybrid category funds is lower for 1-, 3-, 5- and 10-years compared to large-cap funds, the Sharpe ratio these two categories is similar as shown in Table 7 above.
One can also look at the Sharpe ratio of other mutual fund categories analysed in Tables 7 and 8.
Summary
As the 2008 Global Financial Crisis (GFC) showed previously uncorrelated assets became correlated as most of the assets classes during the crisis fell sharply together. Same is the case in 2022 when all financial assets fell heavily except crude oil and some metals.
Correlation of assets did not work when investors required it the most. In market parlance, this is referred to as correlation breakdown.
Having said that, it is still better to hold uncorrelated assets in one's portfolio to benefit from the principles of portfolio diversification.
For example, gold as an asset class exhibits low correlation to stock market returns. Gold in 2022, 2020, 2019, 2018 and 2016 could have provided downside protection to your overall portfolio in the Indian context.
If you are holding a combination of equity and debt mutual funds, one can achieve superior risk-adjusted returns by adding some gold ETFs in their stock-bond portfolios. In some years, gold may provide downside protection to the overall portfolio.
Correlation
of one or perfect correlation between two asset classes means their asset
prices tend to move in tandem. Correlation of zero means asset prices
move in opposite direction--if one asset moves up, the other tends to
move down.
As shown above, gold ETF returns are uncorrelated to Indian equity fund returns.
Equity - International funds returns too are uncorrelated to Indian equity fund returns.
Long-term trailing returns of equity large-cap and Aggressive hybrid funds look similar; though the former give slightly better returns overall. On a risk-adjusted basis (Sharpe ratio), aggressive hybrid funds tend to provide better risk-adjusted returns.
But, there are slight differences in some calendar year returns of large-cap and aggressive hybrid funds.
Returns of gilt, dynamic bond, banking & PSU and corporate bond categories look similar on a 3-, 5- and 10-year basis, though trailing returns of gilt funds are slightly superior to those of dynamic bond, banking & PSU and corporate bond funds.
Returns of floater funds are similar to those of dynamic bond, banking & PSU and corporate bond funds.
Trailing returns of liquid funds (debt) closely resemble those of arbitrage funds (hybrid), though the former provide better returns.
As trailing returns of liquid and arbitrage funds are uncannily similar, investors in highest tax brackets can benefit by investing some of their money in arbitrage (hybrid) funds and have superior post-tax returns.
Arbitrage (hybrid) funds have to invest at least 65% in equities, as per SEBI mandate. Hence, they are considered as equity-oriented funds for tax purposes.
From a risk management perspective, it is better to hold some portion of uncorrelated asset classes in one's portfolio and avoid holding funds or asset classes with positive correlation to one another.
Standard Deviation measures the range of an investment's performance. The greater the standard deviation, the greater the investment's volatility.
Sharpe Ratio indicates the reward per unit of risk by using standard deviation and excess return. The higher the Sharpe ratio, the better the investment's historical risk-adjusted performance.
This blog is the first reference point for young and prospective
investors to understand the cyclical nature of mutual fund returns.
Note: SEBI introduced norms
SEBI categorization and rationalization of mutual funds in October
2017. So, AMCs (asset management companies) made several changes to the
mutual fund plans shifting them
from one MF category to another MF category and data aggregators
changed the data retrospectively. As such, before interpreting trailing
returns of more than five years (annual returns before 2018), please be
aware of SEBI categorization rules.
- - -
------------------------------
References and Additional data:
1. Important information relating to SEBI categorization and rationalization of mutual fund plans introduced in 2017:
3. X post / Tweet thread dated 28Jan2024 on strange phenomenon of multi cap funds outperforming flexi cap funds
4. Raw data from Value Research > Annual and Trailing Returns >
-------------------
Read more:
AMFI List of Market Cap: Categorization of Large-, Mid- and Small-Cap Stocks
BSE 500 versus S&P 500 Indices Compare 31Dec2023
Disclosure: I've got a vested interest
in Indian stocks and other investments. It's safe to assume I've interest in the financial instruments / products discussed, if
any.
Disclaimer: The analysis and
opinion provided here are only for information purposes and should not be construed
as investment advice. Investors should consult their own financial advisers
before making any investments. The author is a CFA Charterholder with a vested
interest in financial markets.
CFA Charter credentials - CFA Member Profile
CFA Badge
Viewing Options for this blog in different formats:
He blogs at:
https://ramakrishnavadlamudi.blogspot.com/
https://www.scribd.com/vrk100
X (Twitter) @vrk100